Get Acquainted with the Dashboard
After logging in, the Dashboard opens by default.
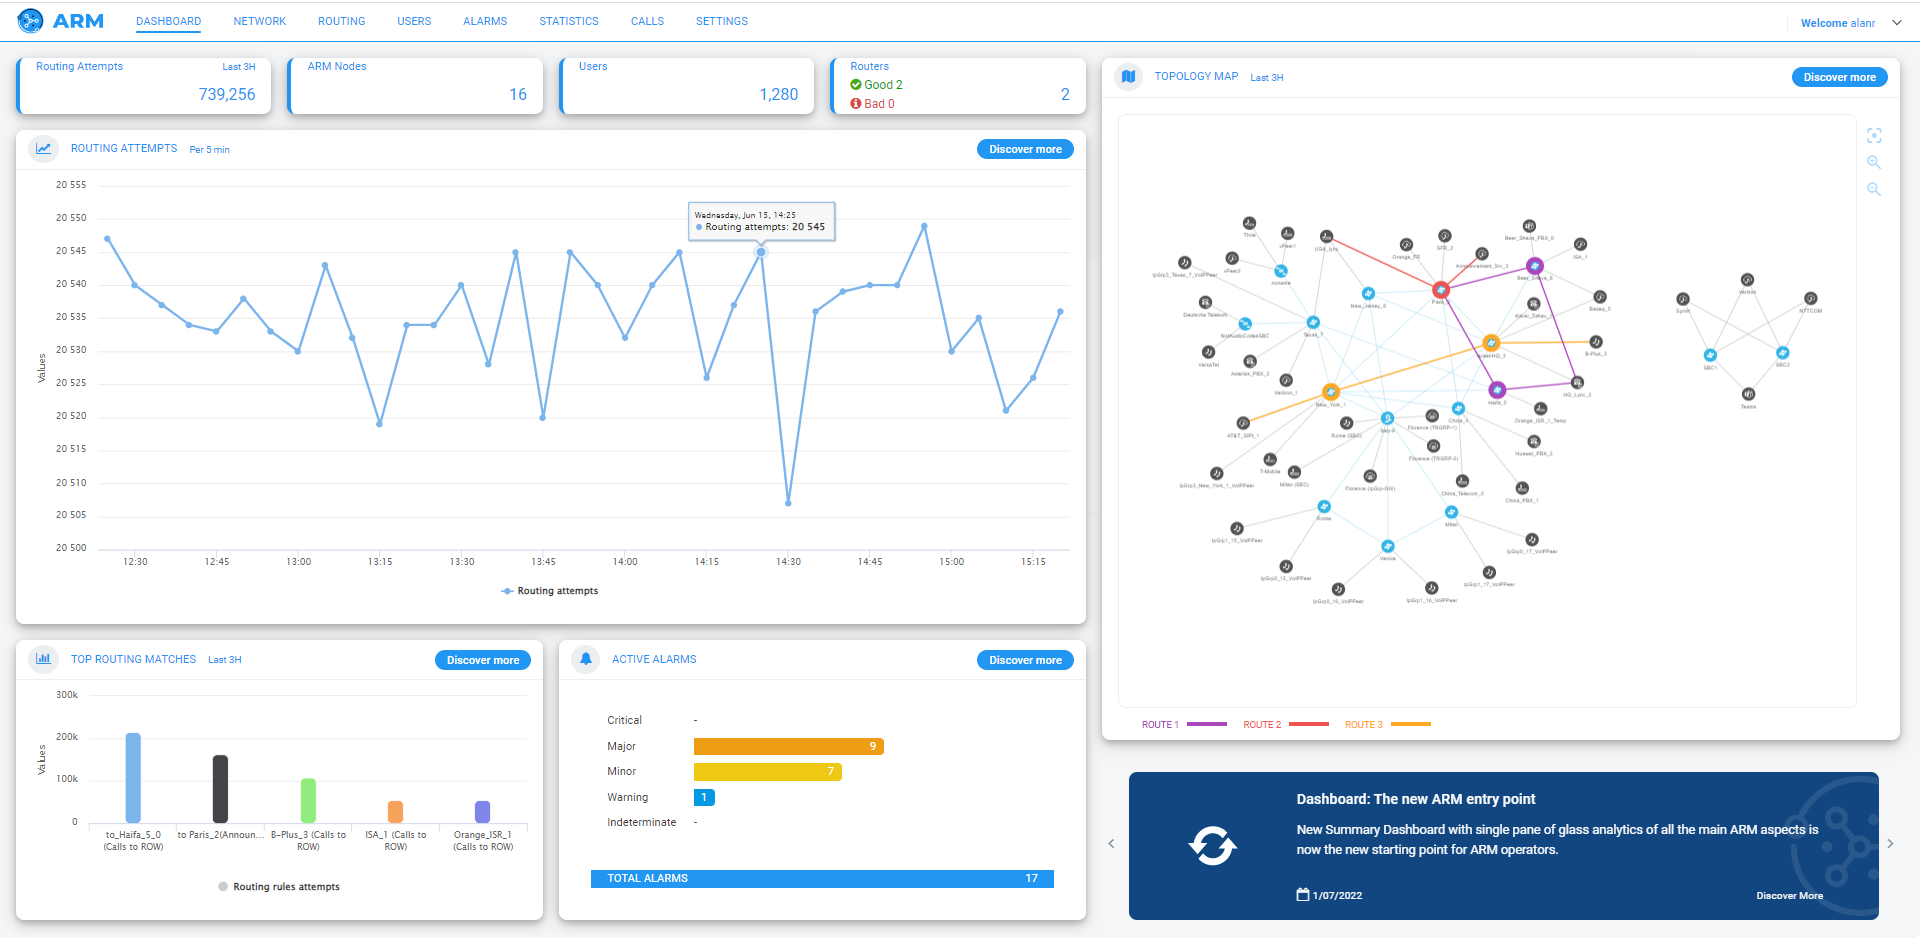
The Dashboard shows (L-R):
|
■
|
Routing Attempts pane. Click Discover more to access the Routing Attempts graph under the Statistics menu (see View Statistics and Reports for more information). In the pane, operators can also immediately see: |
|
●
|
the # of ARM nodes in the managed network |
|
●
|
the # of users in the managed network |
|
●
|
the # of good routers and bad routers in the managed network |
|
■
|
Top Routing Matches pane allowing network operators to determine at a glance the top routing matches that were made in a time frame in their IP telephony network. Click Discover more to directly access the Top Routing Rules graph under the Statistics menu (see under View Statistics and Reports for more information). |
|
■
|
Active Alarms pane, allowing network operators to determine at a glance the active alarms in the network. Click Discover more to access the Active Alarms page under the Alarms menu (see Active Alarms | History Alarms for more information). |
|
■
|
Updates pane. Constantly provides operators new updates and features from the ARM server. To view each new update | feature, click > displayed on the right. To go back, click < then displayed on the left. To access an update | feature, click the Discover More link. To receive dynamic updates, the ARM Web client must have access to AudioCodes' portal. If this is not possible, customers are presented with the latest features released in the version they currently have. |
|
■
|
Network Map page: an uncluttered, operator-friendly summary of the entire IP telephony network. Click Discover more (or navigate to Network > Map) to open the Network Map page. By default, the Network Map page displays all VoIP entities managed in the network. |